Chapter 5 Results
5.1 Gender
In the following section, we explore the social patterns and interests of our cohort by gender. Through this analysis we hoped to answer a few questions, namely: Are men and women interested in the same industries and research areas? And how does gender influence the way that we congregate and collaborate within the Data Science Institute? Note that survey respondents were given the option to identify as gender non-binary or “prefer not to say”. Because no participant selected these options, we were able to perform our gender analysis from the strict bipartition of male and female.
5.1.1 How are our interests related, if at all, to our gender?
5.1.1.1 Introduction:
In our analysis of the aspiring data scientists in our class by gender, we wanted to identify if any differences existed in our professional and academic interests. In our survey, we asked participants to select the industry that they would most like to work in as well as the topic that they would most want to learn more about. Our first heatmap analyzes the relationship between industry preference and gender. The second heatmap explores a similar question about one’s preference in a data science research topic.
5.1.1.2 Analysis
5.1.1.2.1 Gendered Heatmap by Industry:

Irregardless of gender, big tech and finance were the industries that garnered the most interest. However, we found that while more women want to get into consulting, more men are interested in joining start-ups. A priori, we also figured that more men would be interested in sports analytics than women, but the results from our survey reflect an equivalence in interest.
5.1.1.2.2 Gendered Heatmap by Research Topics:
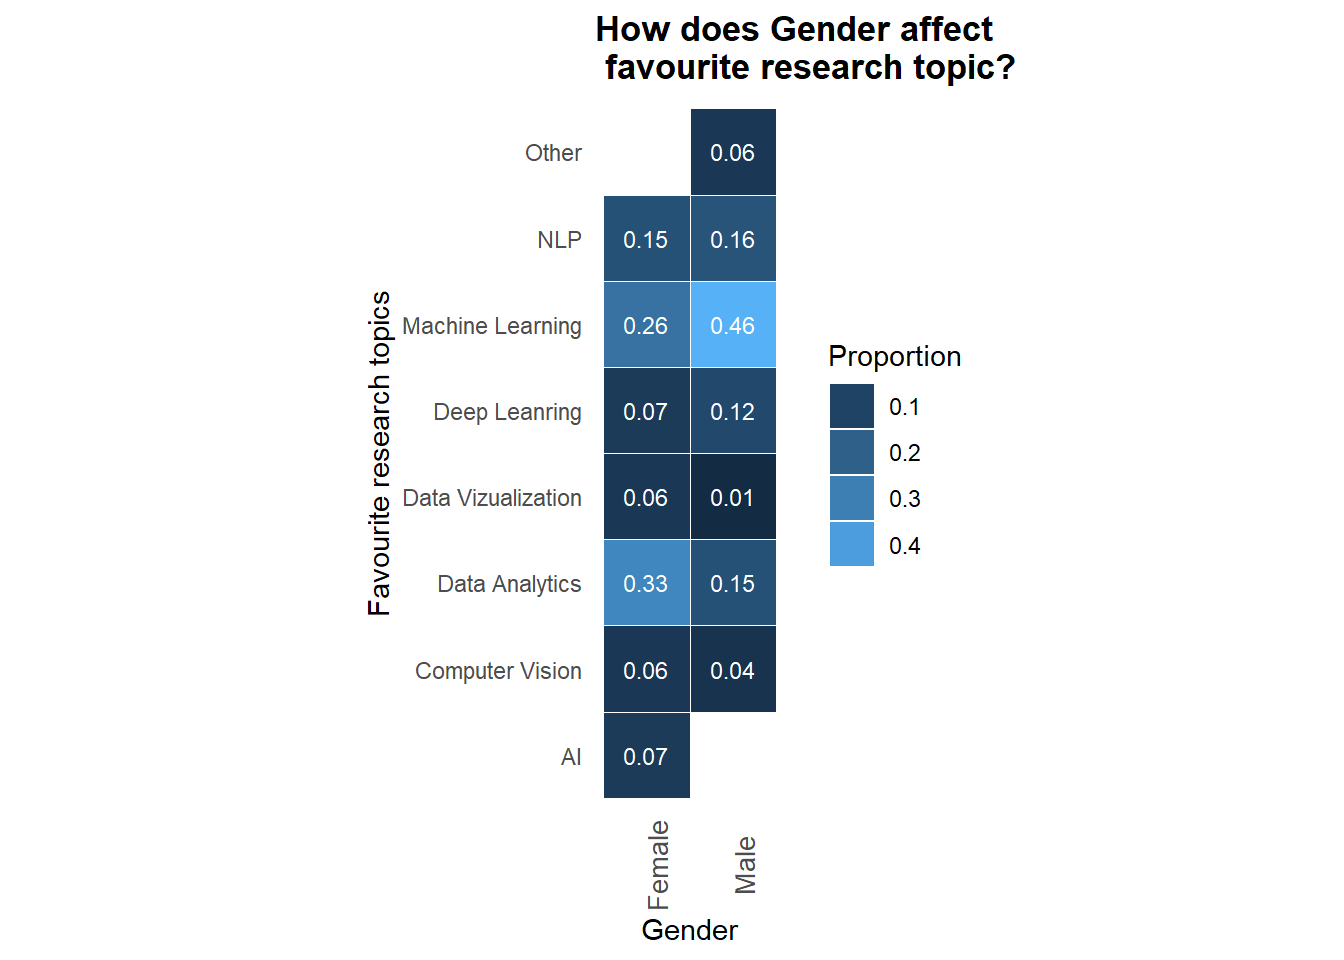
Overall, we notice that the interest in various data science topics is uniformly distributed except in the case of Machine Learning and Data Analytics. We notice that Machine Learning is favored more by men while Data Analytics is favored more by women. This higher proportion for Data Analytics in surveyed women may be related to their higher interest in consulting (see previous heatmap).
5.1.2 How does gender influence the way we socialize?
5.1.2.1 Introduction:
Data Science, like many other STEM fields, is overwhelmingly male. This begs the question: Is data science becoming an all-boys club? We asked survey participants to select at most five people with whom they interact the most within our Exploratory Data Analysis and Visualization class. Using this data, we were able to explore patterns in the social interactions among our classmates.
5.1.2.2 Analysis
5.1.2.2.1 How often do we pick friends of the same gender?
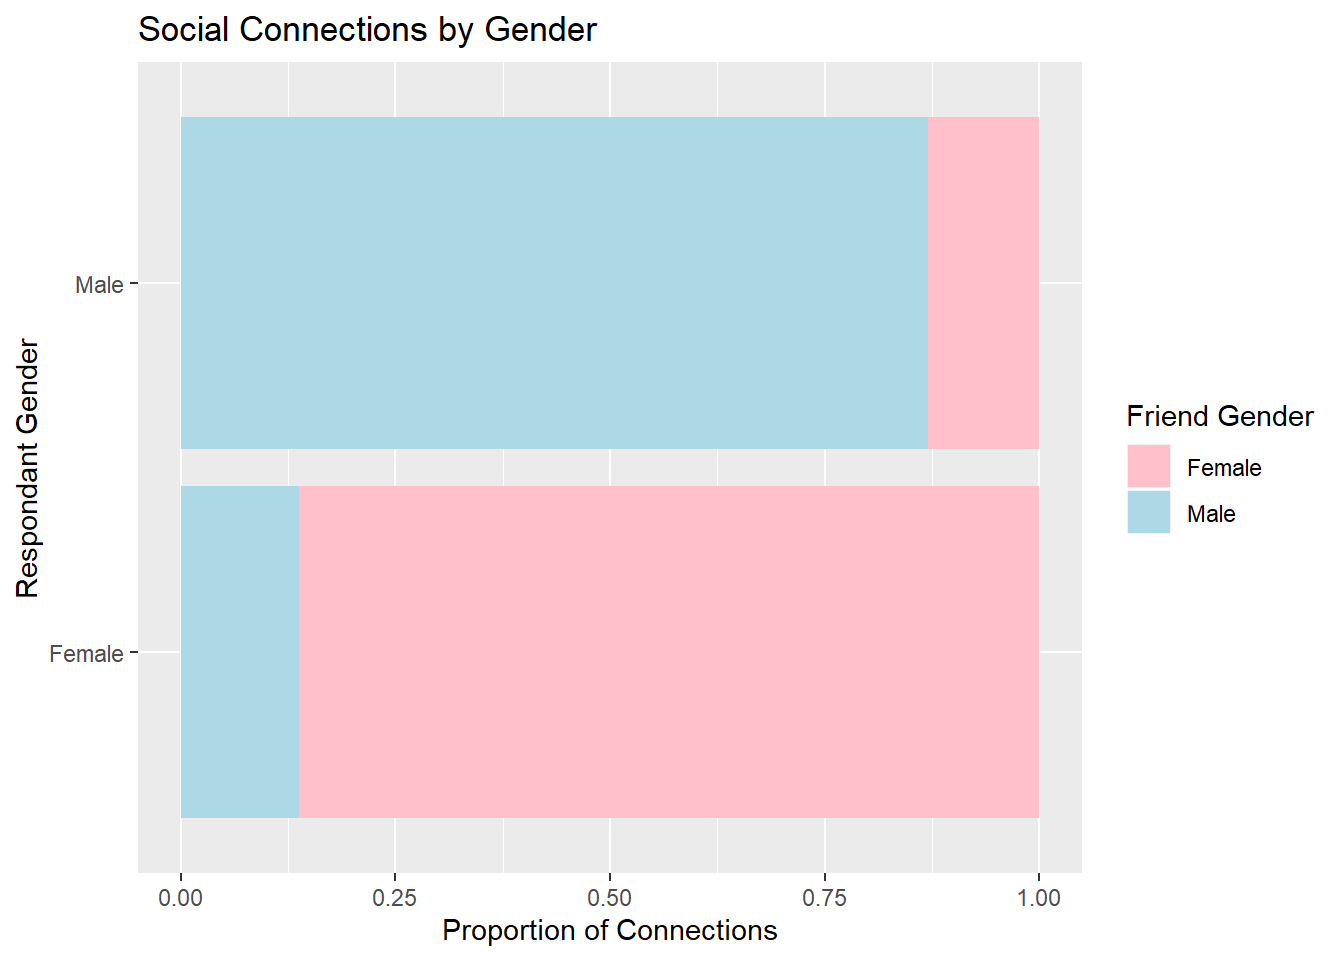
This horizontal stacked bar chart shows that men and women more often listed people of their same gender when reflecting on their social circle. In a perfect world, these bars would be split directly down the middle. However, according to our data, intragender connections represent 87% of relationships for both men and women.
5.2 Academic Background
5.2.1 How are our interests related, if at all, to our academic background?
5.2.1.1 Introduction:
In this section, we explore the same question as in this last section; however, this time we look at the responses from the lense of academic background. Do students of a particular background tend to have similar interests with respect to industry and research interests?
5.2.1.2 Analysis:
5.2.1.2.1 How does academic background affect our choice of industry?
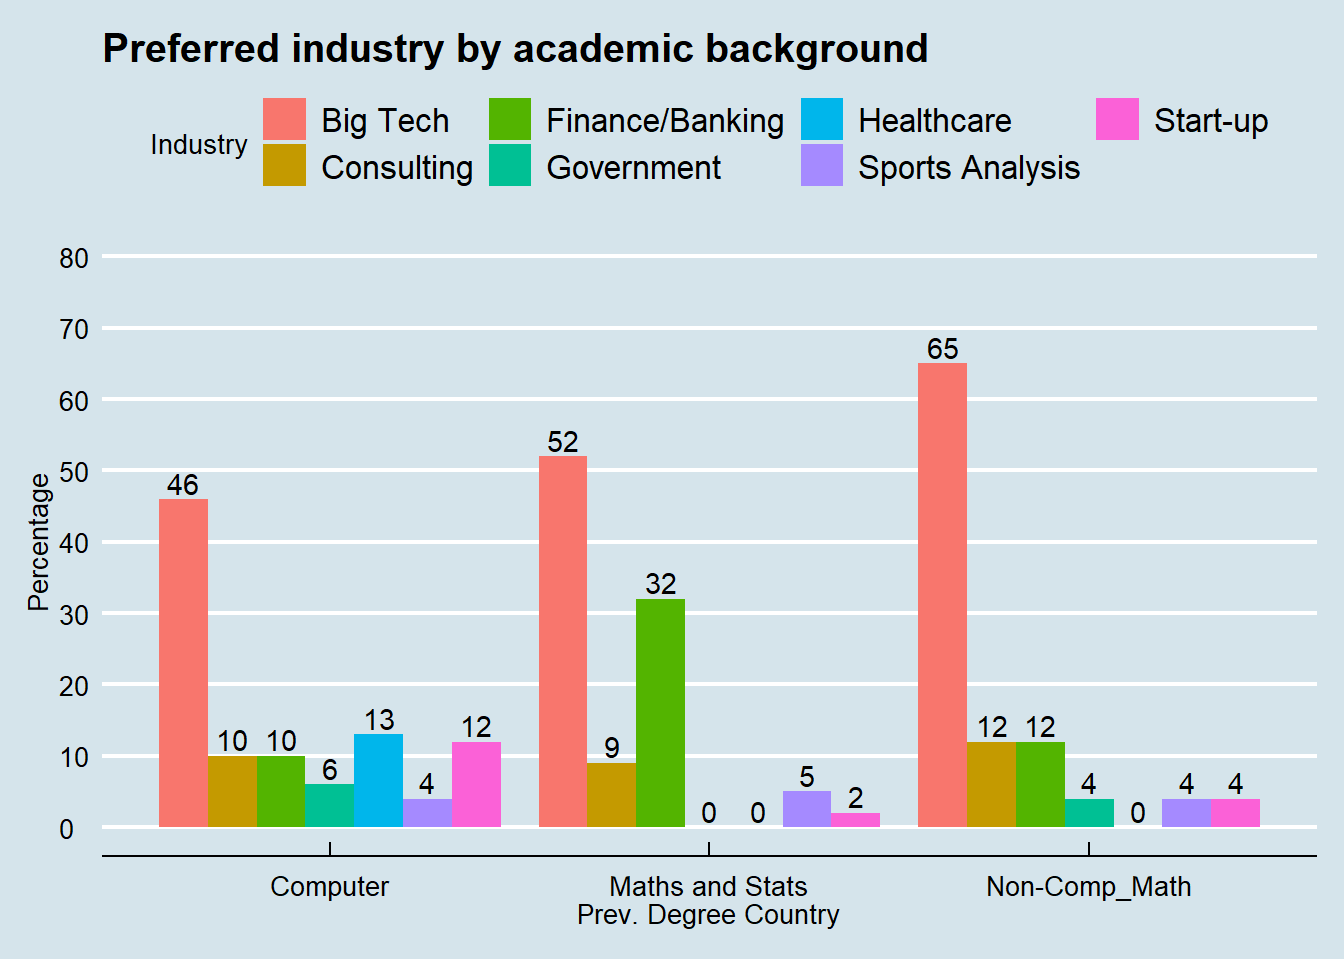
Across academic backgrounds, big tech firms reign supreme as the most popular industry for post-graduation. Perhaps, a majority of theses students chose to pursue a Master’s degree at Columbia so that they could break into the tech industry. Curiously, survey participants with a Mathematics/Statistics background appear to have a higher affinity for the opportunities in the financial sector. Additionally, of those who responded, only people with a history in a computer-related fields reported an interest in healthcare opportunities.
5.2.1.2.2 How does academic background affect our choice of research topics?
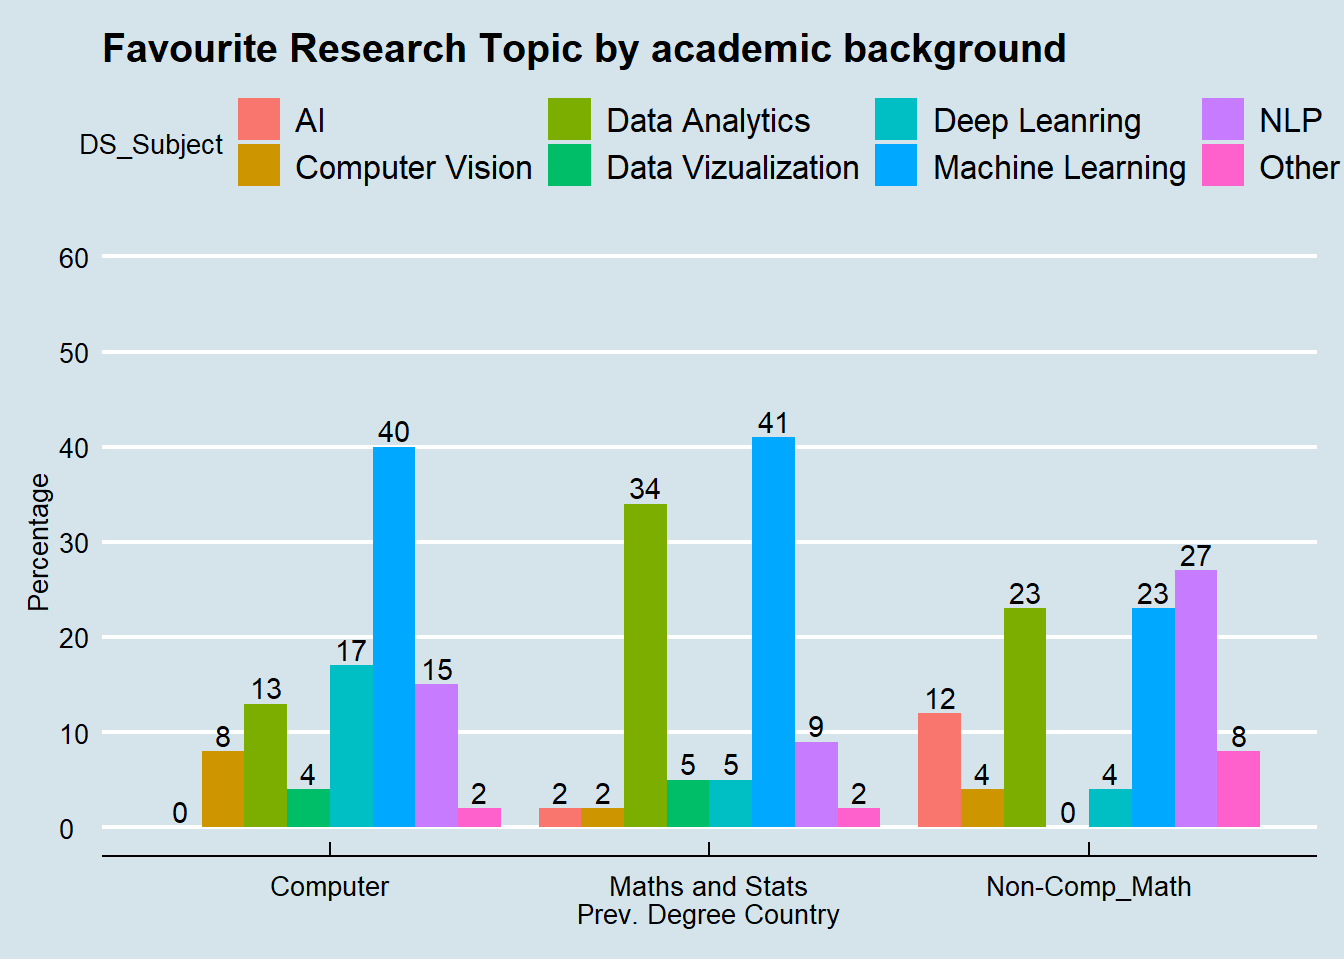
As previously mentioned, the field of data science is primarily comprised of principles from computing fields and mathematics/statistics. With this in mind, it comes as no surprise that the greater population from these majors prefers to study topics in Machine Learning. While, when we observe the responses from those whose academic background is outside of these areas, the research topic with the most draw is Natural Language Processing. NLP has broad applications in many fields outside of tech, including policy, education, and linguistics. Therefore, maybe students coming from other disciplines simply want to learn data science principles so that they can return to their original field and apply data-centric techniques.
5.3 Country of Previous Education
5.3.1 How does the location of one’s previous study affect how they are dealing with the pressures of attending graduate school in NYC?
5.3.1.1 Introduction:
Adjusting to life in New York City can be difficult for anyone. But imagine having to make that adjustment while matriculating through a graduate-level curriculum at an Ivy League institution! Wanting to study attitudes within our cohort, we included a couple of likert questions in our survey in order to gauge how well students were adjusting. How do students who have previously studied in the United States fair alongside their international peers with regard to life in the city and maintaining a healthy work-life balance?
5.3.1.1.1 Background breakdown by prior institution location:
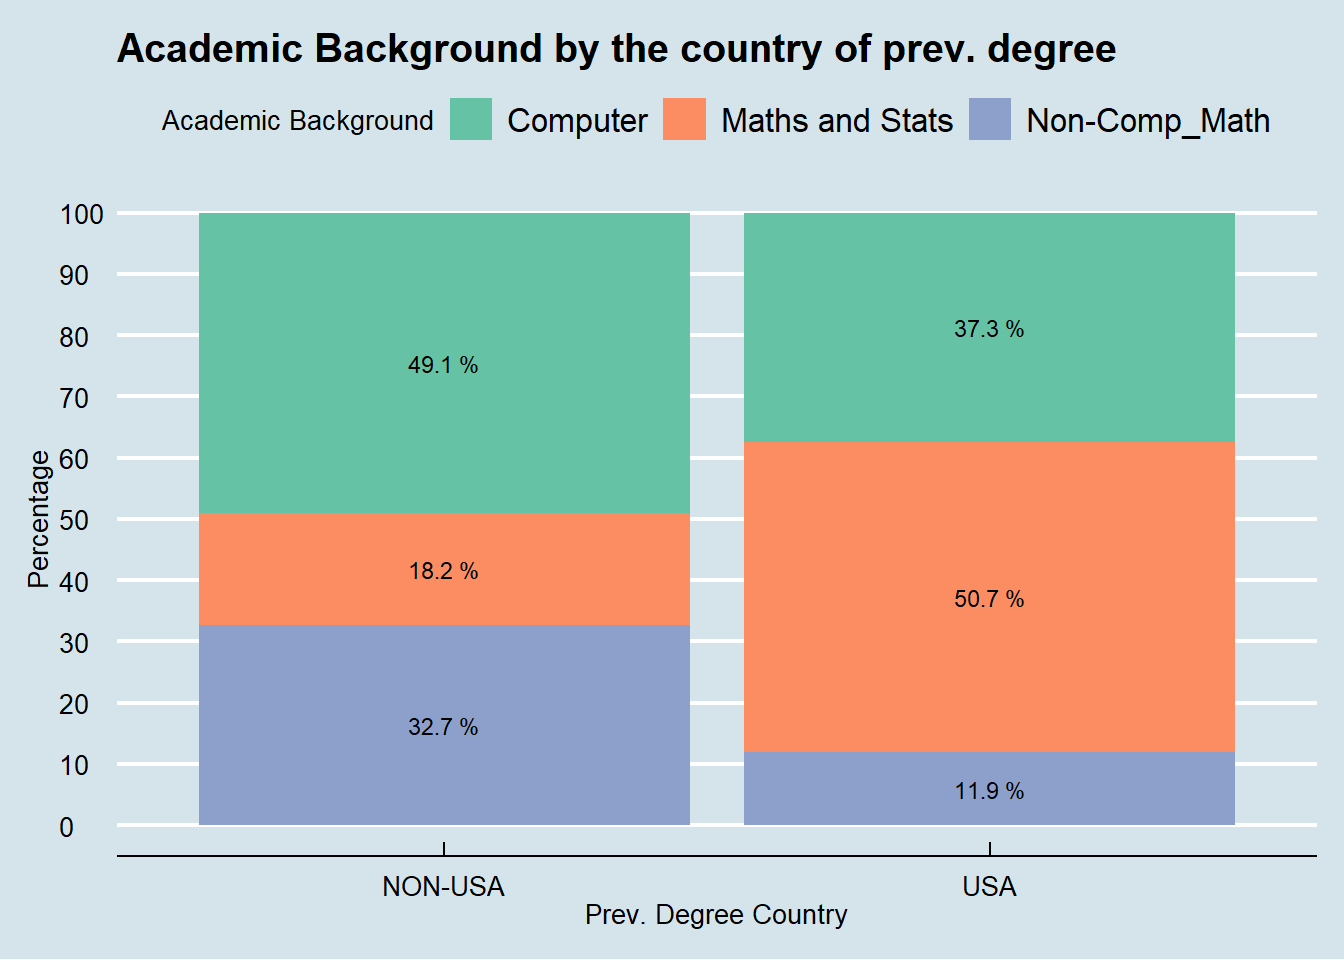
To provide some background information and frame the discussion and analysis in this section, the stacked bar chart above visualizes the breakdown of academic background of the surveyed DSI students, grouped by the location of their prior institution. Notice that a greater proportion of students with a Mathematics/Statistics background came from an institution in the United States. In surveyed students who came from an international university, we observed a greater proportion of respondents with a computing background.
5.3.1.2 Analysis
5.3.1.2.1 I love New York City:
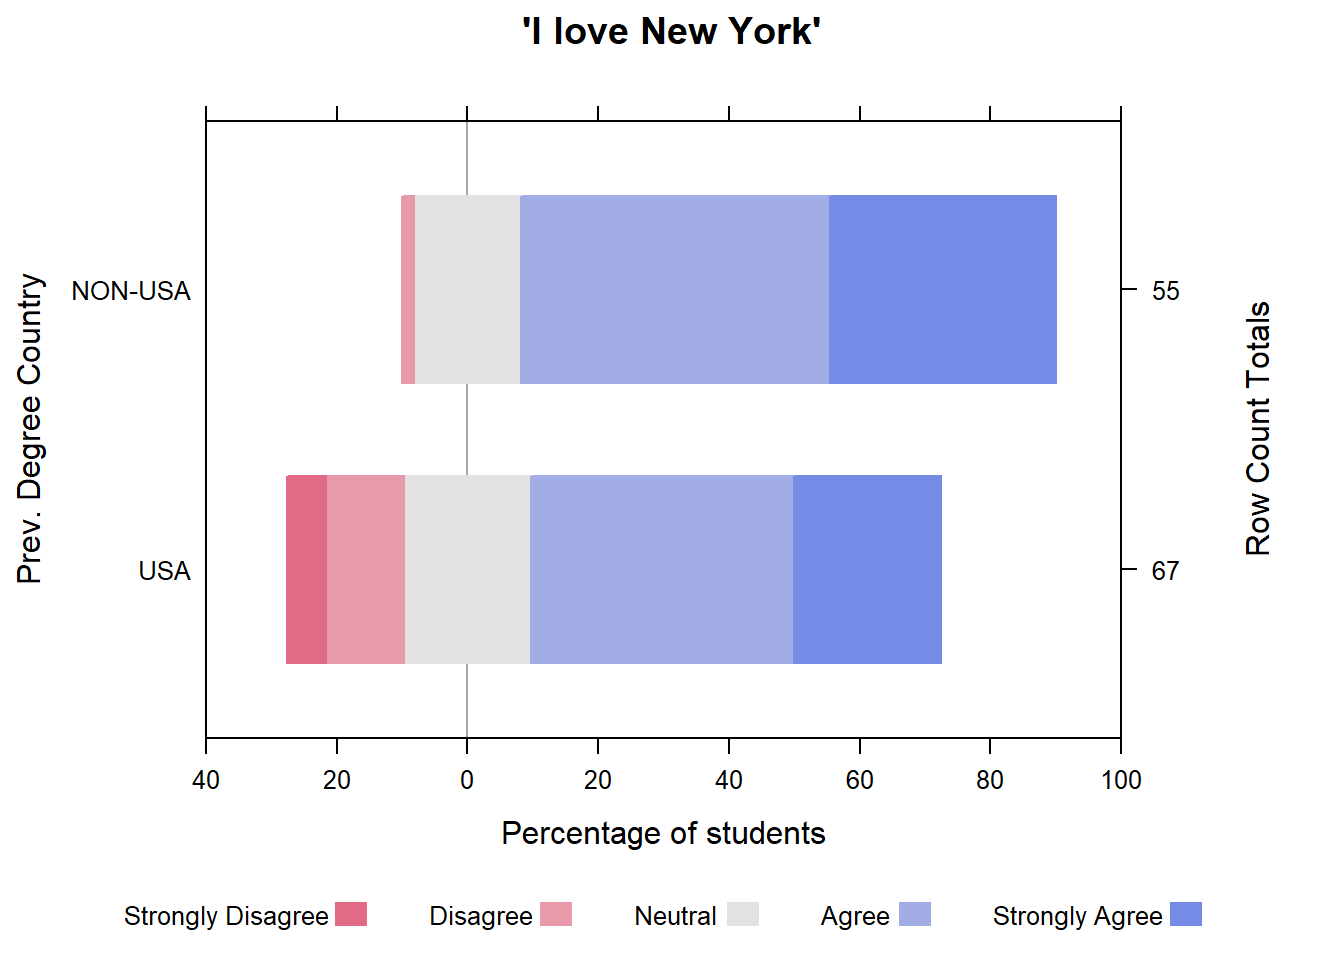
A priori, we would have expected American students, being native to the country, to have a higher affinity for life in the city. However, our data shows that the opposite is actually the case. Responses from students who studied internationally were reasonably skewed to “Strongly Agree” with absolutely no students in the group answering “Strongly Disagree”.
5.3.1.2.2 Chill Mosaic:
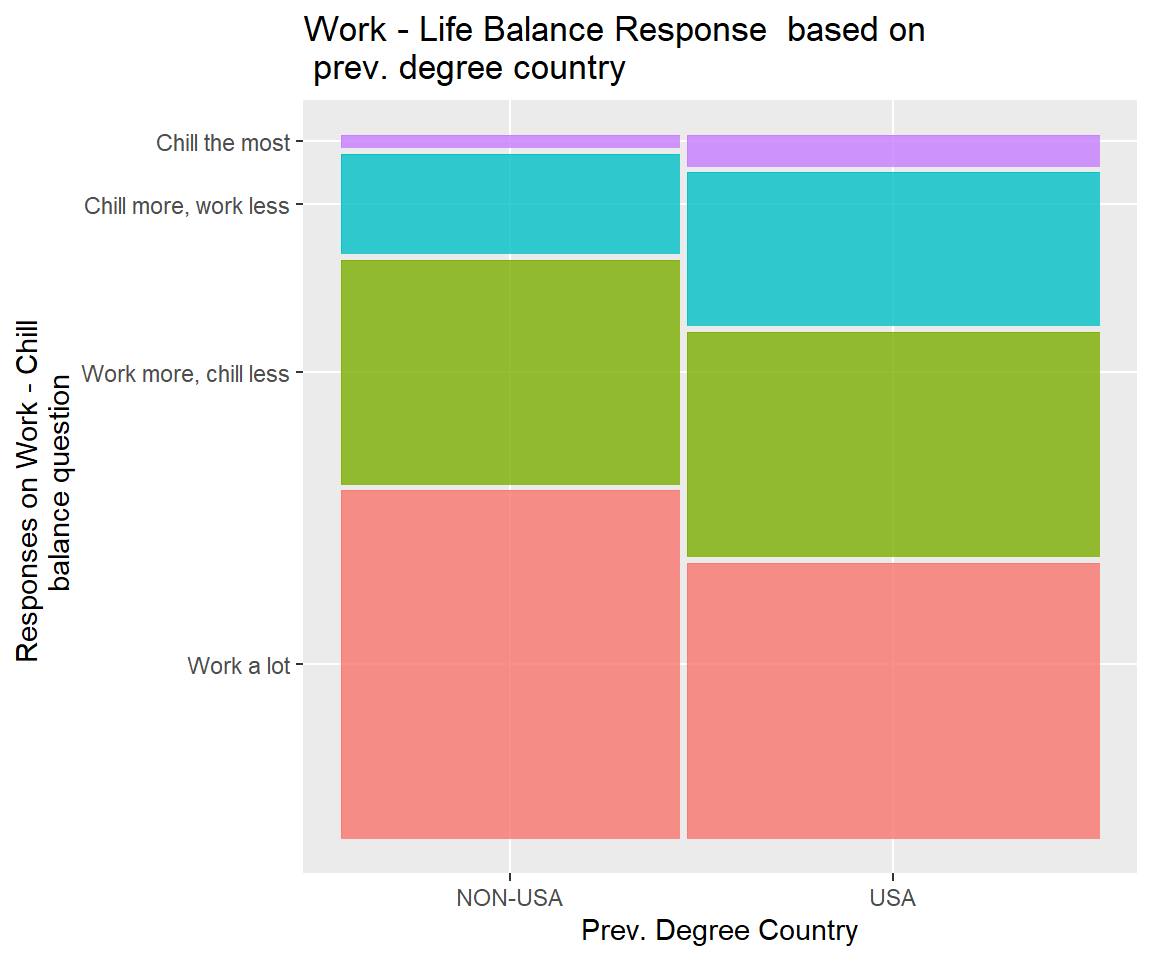
We found overall that students who have done their previous education in the US are “chillin’” somewhat more than students coming from overseas. Why would this be? Perhaps, domestic students are more accustomed to the culture of American institutions. Another possible explanation for this disparity could be that credit-hour and work-study requirements are stricter for students with previous degress from international universities.
5.1.2.2.2 Social Network Graph
The following applet is an interactive visualization of the social connections within our Exploratory Data Analysis and Visualization class. Each node represents a person within our class. Men are light blue and women are pink. The gray nodes are people who did not fill out the survey. A directed edge from node A to node B represents person A listing person B as social connection in their survey. The nodes that are disconnected from the large network were people who did not list any connections. By moving the cursor over a node, the user can see the country where the person completed their undergraduate education, as well as professional and academic interests. In addition, the user is able to drag nodes to get a better sense of the network structure. Be patient! The network takes some time to load.